

For labs · clinics · health apps
A lab test analyzer that reads the panel the way a clinician does.
Vitrubo is an AI lab test analyzer for laboratories, clinics and health apps. Blood test results arrive as PDF, photo, HL7 or FHIR; the analyzer parses the values, maps them to LOINC, reads them against the patient's history and named medical guidance, and drafts an interpretation for the professional to sign. The patient reads the same analysis in plain language.
- HIPAA compliant
- GDPR compliant
- Encrypted in transit and at rest
- HL7 · FHIR R4
An analyzer that rests on the standards a lab already runs.

LOINC codes
Each blood test result is mapped to one reference standard, whichever lab produced it. Units are converted to UCUM, so the analyzer compares a value from one laboratory with a value from another.
In and out
HL7 and FHIR R4 in; FHIR and JSON out. The analyzer sits behind the systems a lab or clinic already runs, with no change to how a test result is produced.
Native record
One FHIR R4 record per person, every result coded and dated, the source document kept. A HIPAA business associate agreement for US deployments and GDPR Article 28 terms as standard.
Stanford MedAgentBench
Every task passed across five runs on the Stanford MedAgentBench benchmark. The same reasoning reads a lab test result for your patients.
Who puts a lab test analyzer behind their results?
The analyzer sits at a different step for each buyer, and the person who holds the result reads the same analysis at the end. In every case the professional signs; the analyzer drafts.
A drafted comment beside every flagged blood test result.
The analyzer reads the panel as the scientist would and writes the comment in the style the lab already uses. It is approved inside the existing release step, and the right follow-up test is raised while the sample is still fresh.
Every lab test read against the whole history.
Blood tests, discharge summaries and letters are parsed, coded and merged into one record before the consultation. A result that looks ordinary on its own is read beside the draws that came before it.
A blood test analyzer inside your product.
Embed the analyzer, bundle it or resell it under your brand. Users upload a test result or connect a lab feed, and the report regenerates online with every new value, which gives them a reason to return.
What the lab test analyzer does with a panel.
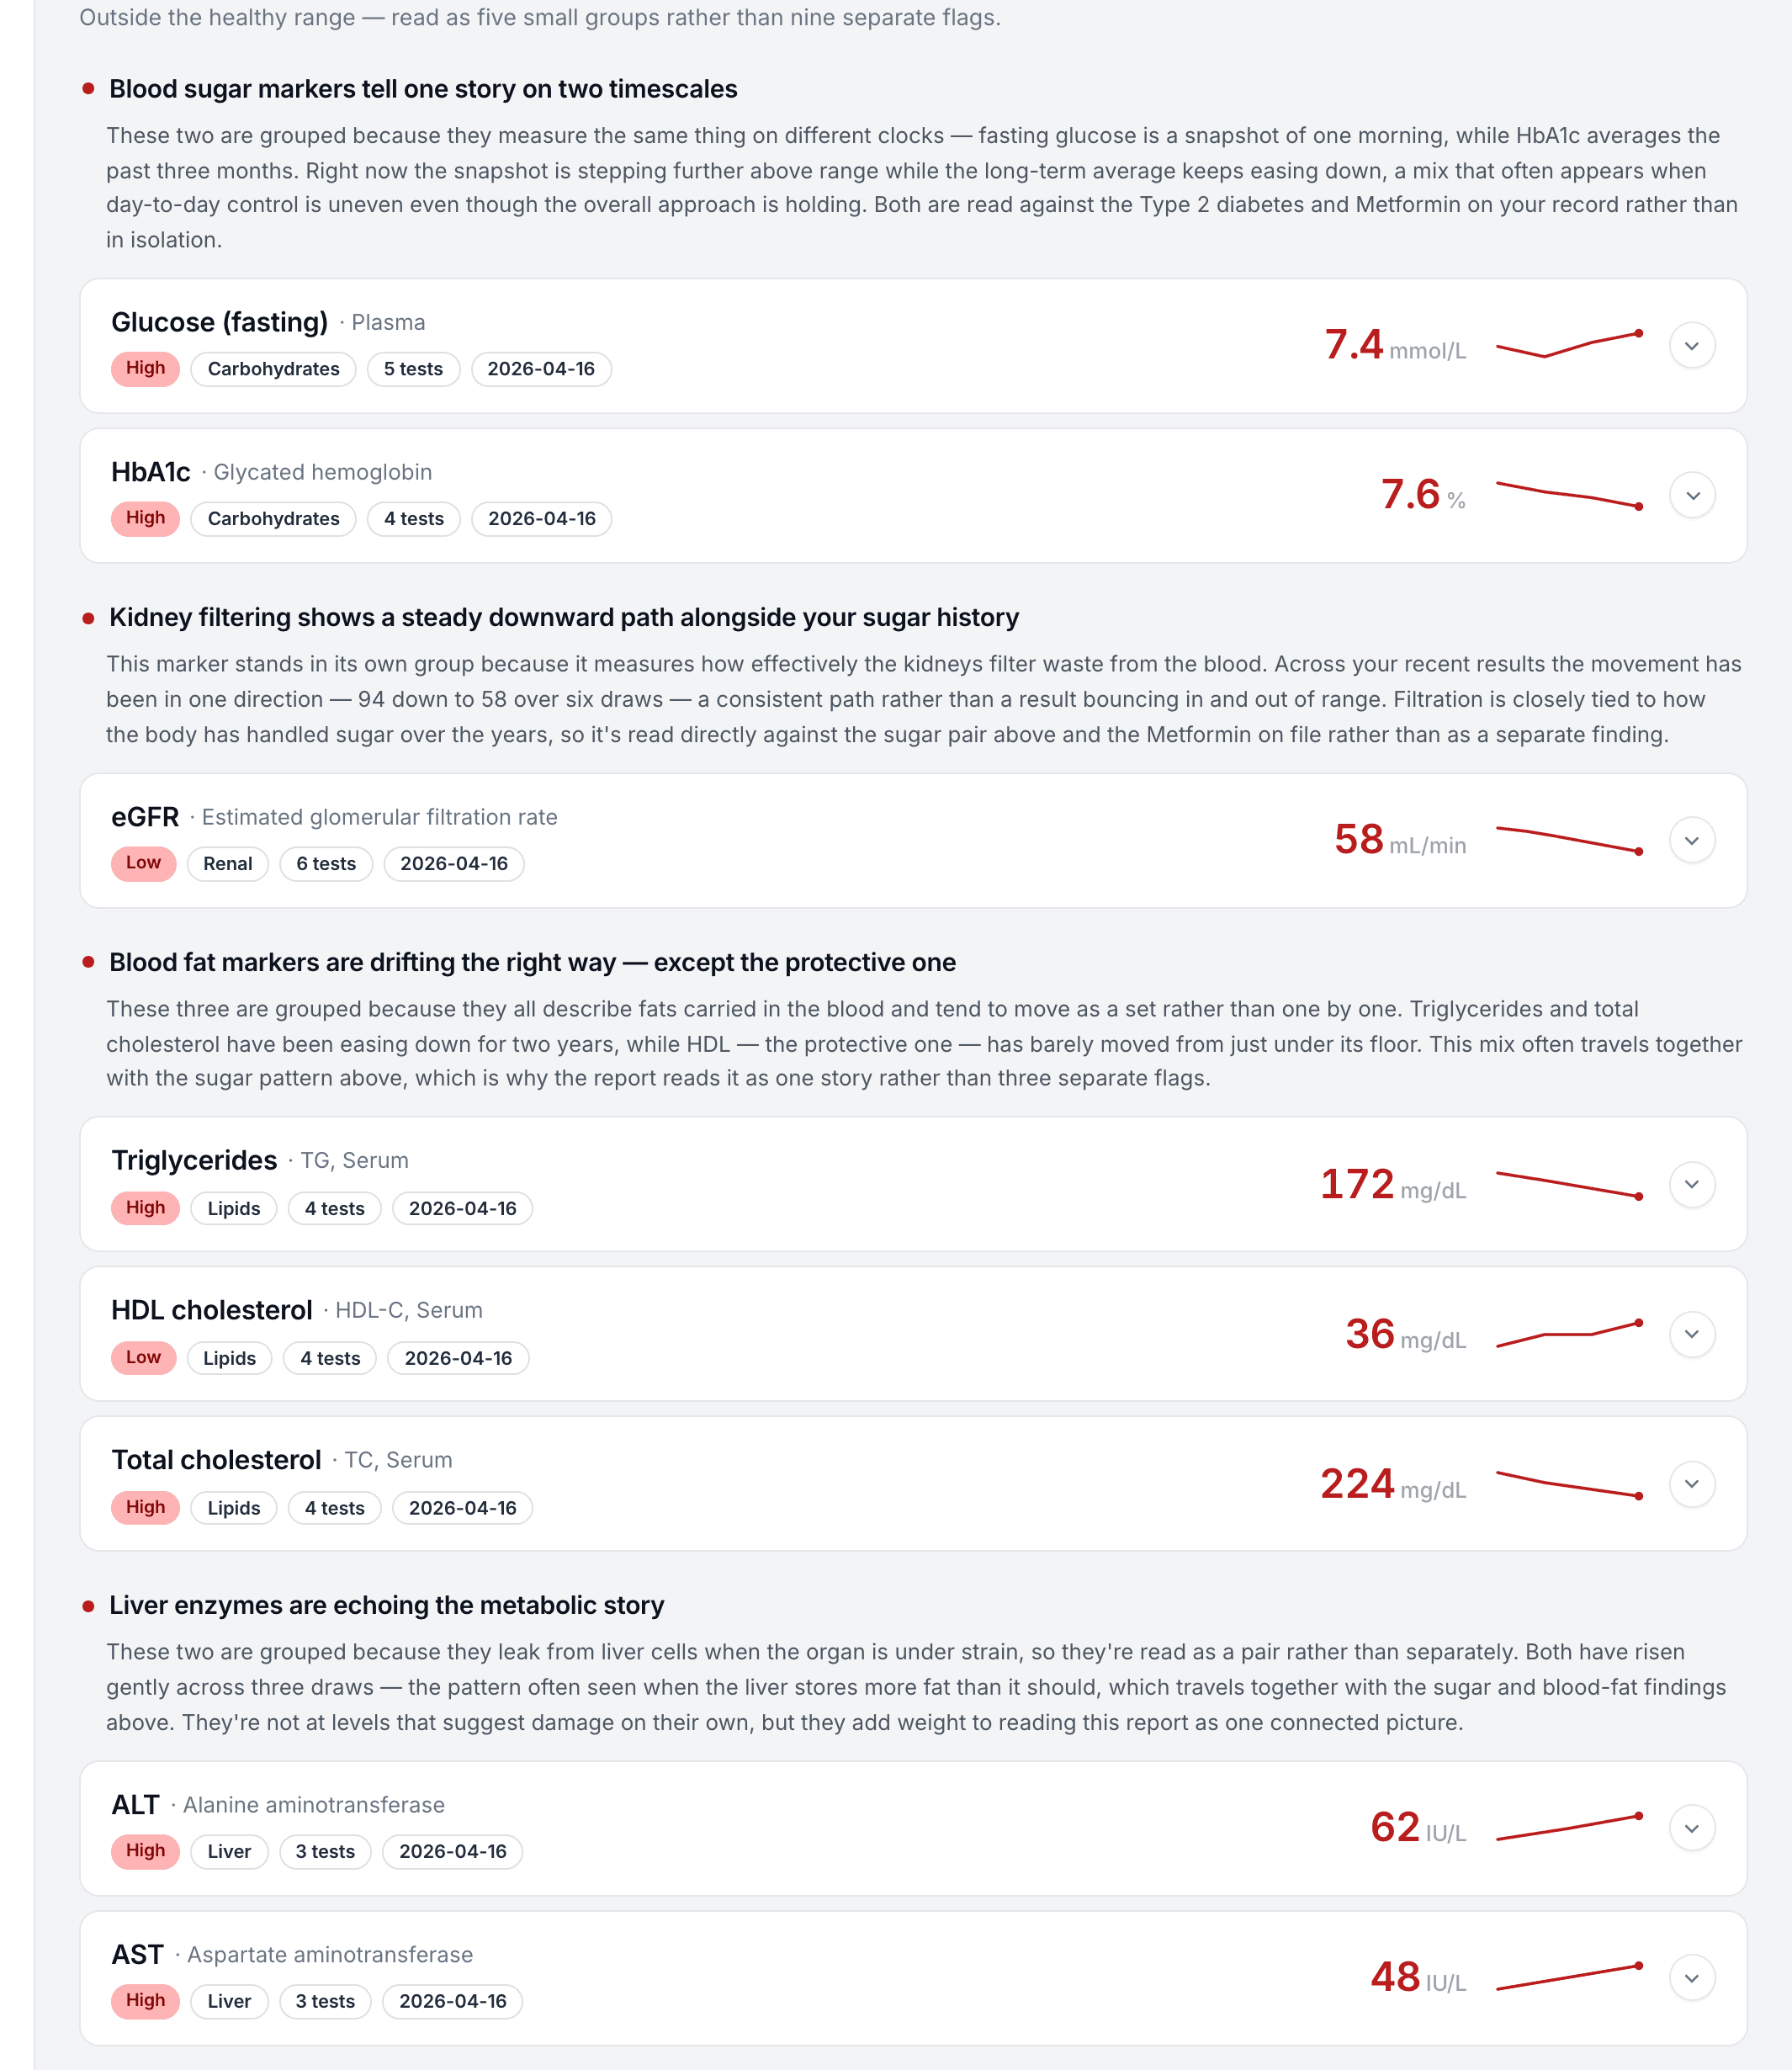
A blood test arrives as a column of values against a column of ranges. The analyzer reads them together: which markers move as a group, what the medication list explains, what one borderline value means beside two others. It then groups the flagged results into a few connected stories rather than a longer table.
Different laboratories, different units, one line. Because every lab test result is normalised to LOINC and UCUM, the analyzer can analyze results from any source as one trend. A marker drifting for years, unremarkable in any single blood test, becomes visible.
Every statement in the analysis links to named medical guidance: EHA, WHO, NICE, KDIGO, BSH. Up to 30 sources can sit behind one biomarker view, and a chip opens the publication, so a clinician checks the basis for a claim rather than trusting the analyzer.
Needs attention, worth watching, back to normal, always normal. Each new blood test result redraws the report and the previous version stays as history, so the record shows how the reading changed, not only the latest one. A value that returns to normal moves zone rather than disappearing from the report.
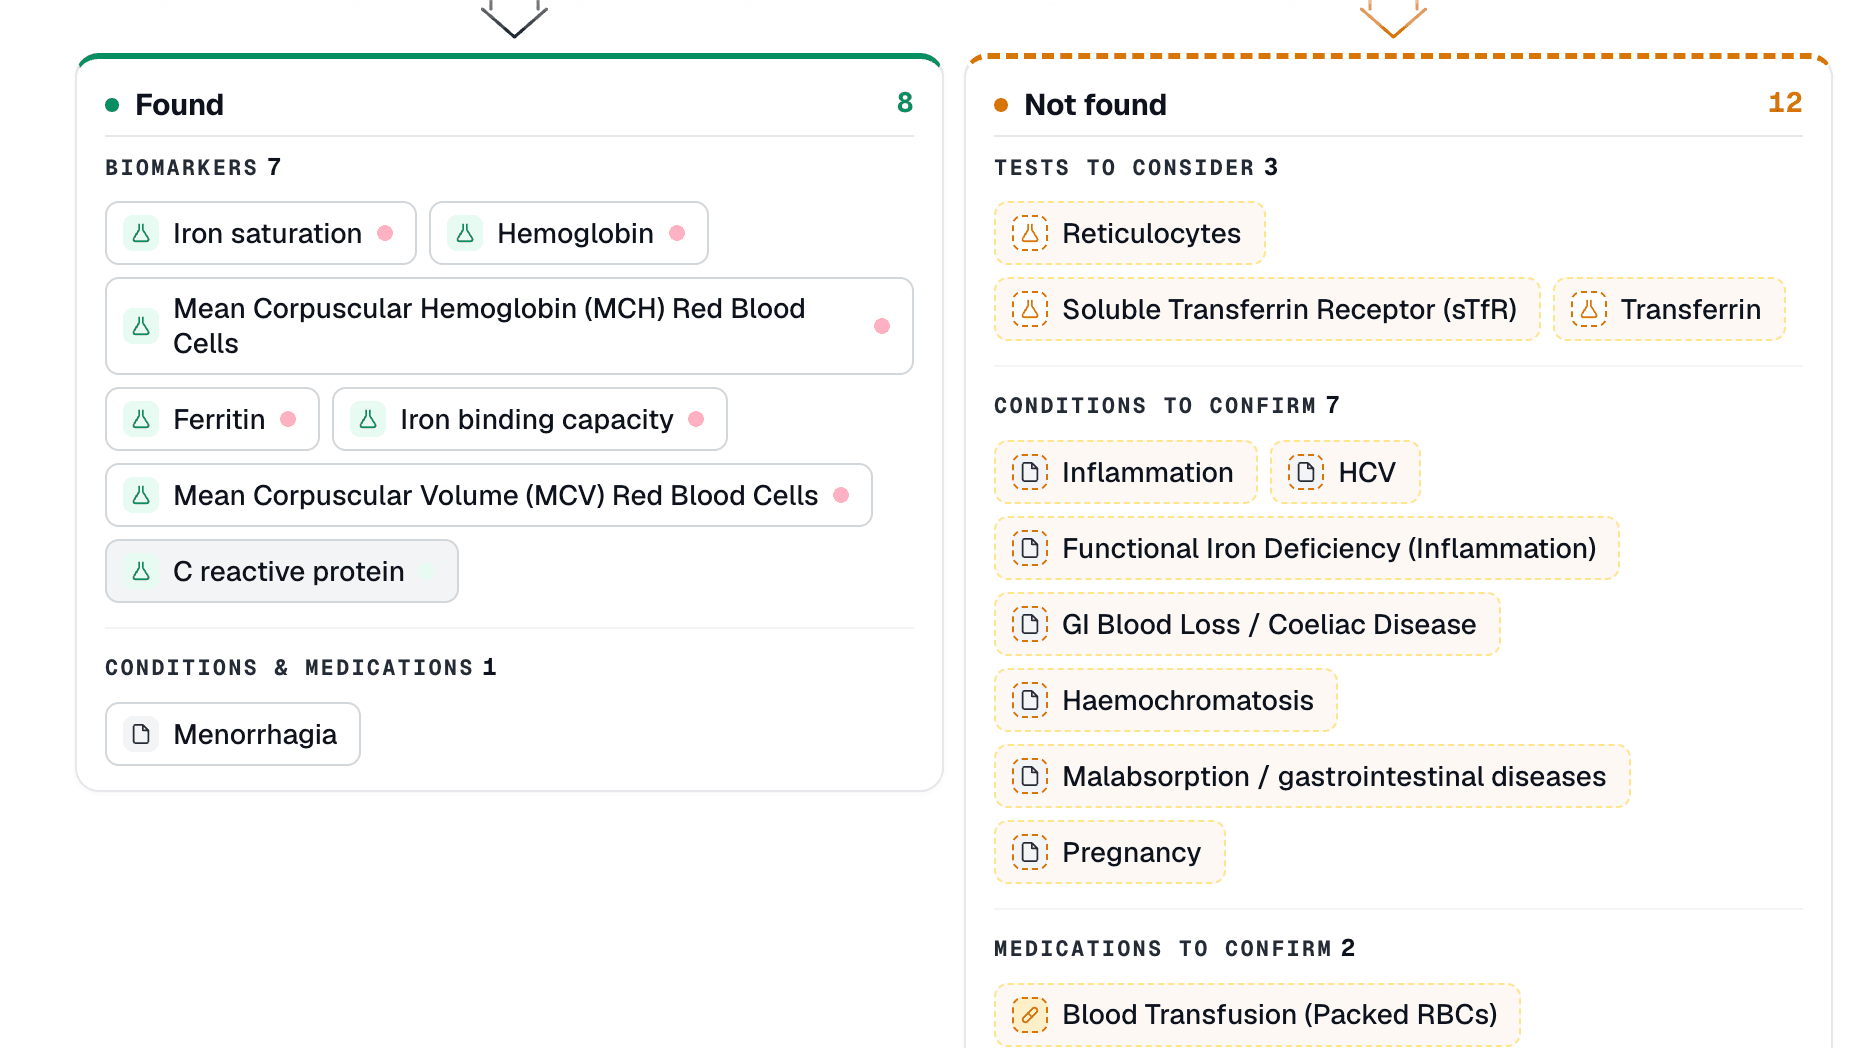
The clinician sees full reasoning, connected conditions and medications, and tests to consider. The patient sees the same lab test result in plain language, with what to discuss at the next appointment. Vitrudoc, an AI chat grounded only in the person's own record, answers questions about either view.
Containers on your infrastructure or a private cloud. You own the keys; Vitrubo ships versioned builds and has no access to the data. Models see values and an internal ID, never a name, and every number, unit, range and flag is computed by deterministic code.
One flagged value, read against three draws.
This is what the analyzer returns for a single blood test result: the value against its reference range, the two draws before it on the same line, and the guideline chip that names where the reading comes from. The analyzer does the same for every flagged value in a blood test, then groups them into the stories the clinician sees. The live report follows a healthy person through a period of lifestyle change, with every lab test read as one story rather than a folder of separate results.
Connects to the systems that produce the result.
Full integration.
Plug the analyzer into the LIS, EHR or EMR you already run. Test results flow in as HL7 or FHIR, the drafted analysis flows back into the same system for sign-off, and the follow-up test is raised from the record rather than by hand.
PlatformWhite label, no integration.
A role-based portal under your brand for the lab, the clinician and the patient, plus branded PDFs. Staff review the analysis online; patients read their blood test results in the same place. No engineering project is needed to begin.
API first.
Teams with their own portal take the API alone: the structured lab test result and its analysis as JSON, straight into your product. Recognition, normalisation and interpretation, together or one at a time.
Portal and API, for every customer.
Every result mapped to LOINC, units made comparable, the record kept in FHIR R4. Containers on your infrastructure, your keys.
Why not paste a blood test into a chatbot?
Because a lab test result is not a prompt, and a blood test is read against a record, not on its own.
A general-purpose model
- Built to write, not to analyze blood tests; a general model was never validated on laboratory work.
- Misreads a number in a multi-page lab PDF or a phone photo and carries on without noticing.
- No normalisation: units and reference ranges differ from lab to lab and stay that way, so a trend across two laboratories is not possible.
- Reads each blood test on its own; the draw from last year and the medication list are not in the picture.
- No source behind a statement, so a clinician has nothing to check and a patient has nothing to bring to an appointment.
A purpose-built lab test analyzer
- Lab-native ingestion: PDF, photo, HL7 and FHIR are parsed, and every number is computed by deterministic code, never written by a model.
- A normalisation engine for units, reference ranges and LOINC, so a blood test result from any lab lands on the same scale.
- Several models review the same case; their disagreements are resolved and omissions caught before the analyzer shows a draft.
- Cited claim by claim: each statement links the medical guidance it rests on, and one click opens the publication.
- Reads the whole record: conditions, medications, previous draws and hospital notes are part of the analysis of every new test result.
Every statement rests on named medical guidance. Each chip opens the same guideline page a clinician would read.
From first call to production, on your own lab tests.
An evaluation of the analyzer runs on your result formats, not on ours: the blood tests your lab or clinic already produces, in the files it already produces them in. Six steps, none of them a commitment until the last.
Talk to the team
A short call about your panels, your result formats and the step in the process where the analyzer should sit.
Sandbox and API docs
Test access for your team, with the API contract and sample payloads for a blood test result in HL7, FHIR and JSON.
Run your own lab tests
Send real formats, anonymised. Blood, urine and allergy panels, as PDF, photo or HL7, in the mix of files your lab or clinic sees on an ordinary day.
Validate the output
Your scientist or clinician reviews what the analyzer drafted against their own reading of the same results, alone or together with us.
No commitment at this stage
Evaluation is an evaluation. Comment style, reference ranges and branding are configured here, and the analyzer is tuned to the way your team writes.
Production when ready
Inside your perimeter or a private cloud, connected to the LIS or EHR, or portal-first. Versioned builds ship to you; the data never leaves.
Questions about the lab test analyzer.
Software that takes a lab test result, structures it, and drafts a reading of it for a professional to review. Vitrubo parses the values from a PDF, photo, HL7 or FHIR feed, maps each one to LOINC, reads the panel against the patient's history and named medical guidance, and returns an interpretation with its sources. It analyzes a blood test the way a clinician reads one: as a panel, against the record, with the source named beside each statement. A clinician or lab scientist signs it; the analyzer does not decide.
Yes, through a lab, clinic or health app that has put Vitrubo behind its results. Vitrubo does not perform or sell tests; it is the reading layer a provider adds to a blood test result, and the layer a person uses to understand results they already hold. The patient view is plain language and educational context to bring to an appointment, not medical advice.
Blood, urine and allergy panels arrive as values and are read as results. Hospital records, prescriptions and notes are read as context, so the analysis of a blood test knows about the medication that explains a shifted value. The analyzer analyzes each result inside the whole panel rather than one line at a time. Numbers, units, ranges and flags are always computed by code, never written by a model.
Every lab test result is mapped to one of more than 17,000 LOINC codes and its unit converted to UCUM, with SNOMED CT, ICD-10, RxNorm and ATC for the conditions and medications around it. Two blood tests from two laboratories therefore land on the same scale, and a trend reads across labs and years as one line.
Every statement links to the medical guidance it rests on: EHA, WHO, NICE, KDIGO, BSH and others, with up to 30 sources behind one biomarker view. Several AI models cross-check each other and their disagreements are resolved before a draft is shown. The analyzer prepares the reading; the professional reviews and signs it.
No. Vitrubo does not diagnose, does not select treatment and does not replace the clinician or the scientist. It drafts a reading of the test results, organises the history and names the tests to consider. The decision and the signature stay with the professional. A patient reading their own blood test results gets educational context for the next appointment, not advice.
The value against its reference range, the previous draws of the same marker on one line, the connected conditions and medications, and the guidance chip that names the source. Flagged results are grouped into a few connected stories in four zones: needs attention, worth watching, back to normal, always normal.
Through the portal or app your organisation runs, under your brand. A blood test result that arrives online from the lab is read by the analyzer and shown to the patient as the same analysis the clinician sees, written in plain language, and can ask Vitrudoc questions that are answered only from their own record. Every new test result regenerates the report and keeps the previous version as history.
A HIPAA business associate agreement for US deployments, a GDPR Article 28 processing agreement and Standard Contractual Clauses as standard. Data is encrypted in transit and at rest, identity never enters the prompt, and in-perimeter deployments keep the keys with you.
HL7 and FHIR R4 in, FHIR and JSON out. A lab connects the LIS so each blood test result is analysed at release; a clinic connects the EHR so the whole history is read before the consultation; a health app takes the API and shows the analysis inside its own product. White-label PDFs and a portal are available without any integration.
Yes. Reference ranges are configured per laboratory, so a test result is flagged against the range your lab publishes rather than a generic one. The drafted comment follows the wording your scientists already use, and the branding on PDFs and in the portal is yours. Each deployment carries its own configuration: guardrails, capability switches and answer style per audience.
In a clinical program at Assuta Medical Center, roughly 100,000 anonymised hospital records were read on premises through InterSystems IRIS for Health, with nothing leaving the perimeter. On Stanford MedAgentBench the same reasoning passed 600 of 600 tasks across five runs. Both are the same analyzer that reads a blood test for a lab or clinic today.
With a call, then sandbox access and API documentation. Your team sends its own anonymised blood tests in the formats it already produces, your scientist or clinician validates the drafts against their own reading, and production follows only when you are ready. There is no self-serve signup.
Demo cases
Invented people, real product. Every case is a synthetic record with a stock portrait: no real patient, no real result. The reports are live.

Robert Hensley
58A year of CKD follow-up with full context supplied.

Emily Carter
34Five visits over nine months with no diagnosis supplied.

Ryan Hayes
30Fifteen months of lifestyle change. The direction of travel is read.
See the analyzer on your own lab tests.
A walkthrough on your result formats and release workflow, sandbox access for your team, and a drafted analysis of your own blood test results.