

For clinicians · labs · health apps
Blood biomarker analysis, from value to sourced reading.
A laboratory measures a blood biomarker; the analysis is what happens next. Vitrubo's blood biomarker analysis can be inspected step by step: numbers computed by deterministic code, every biomarker on one LOINC scale across laboratories and years, each value read against its history, the rest of the panel and the record, and every statement tied to named medical guidance.
- HIPAA compliant
- GDPR compliant
- Encrypted in transit and at rest
- HL7 · FHIR R4
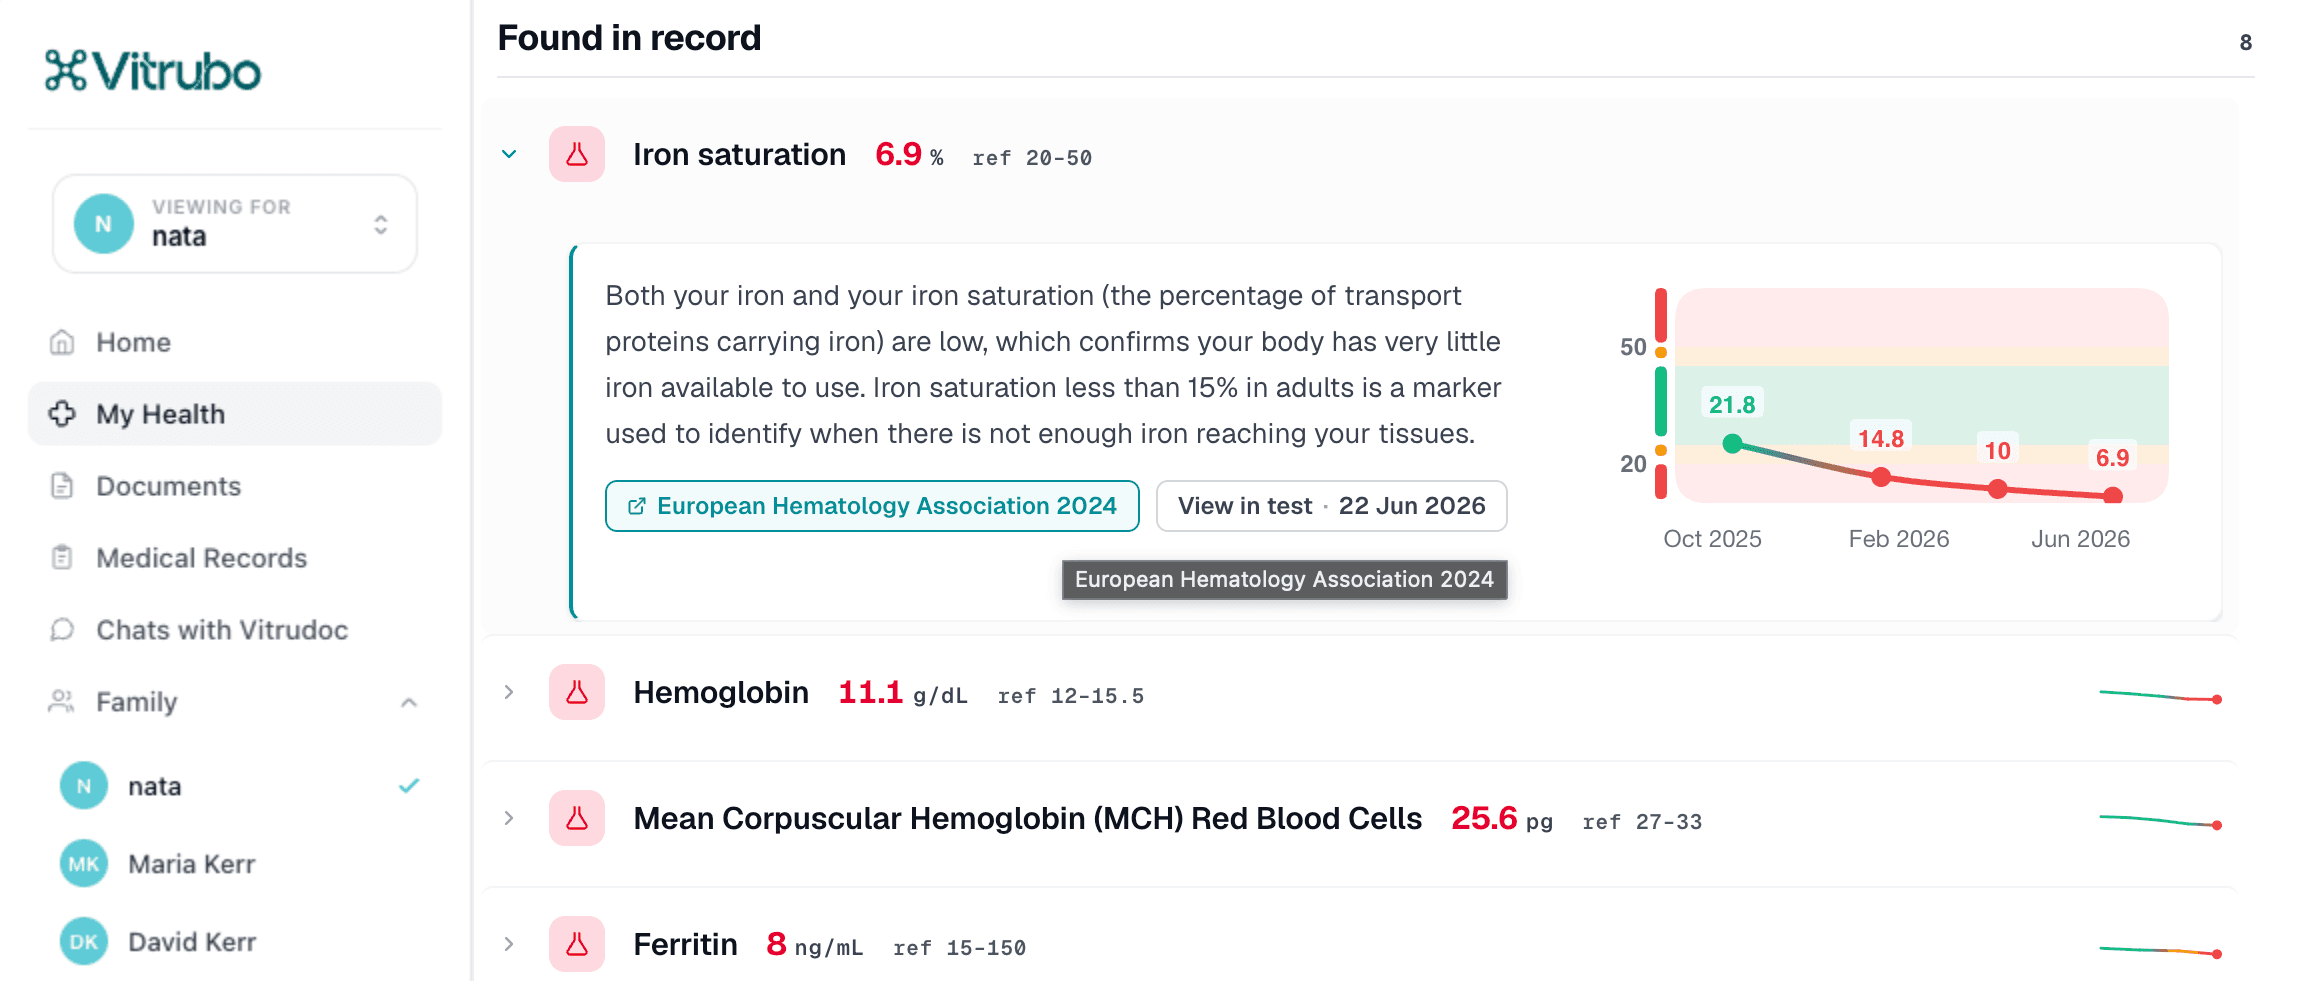
What a blood biomarker analysis rests on.

LOINC codes
Every blood biomarker is mapped to one of 17,000+ LOINC codes and its unit to UCUM before it is analysed, so values from any laboratory and any year are analysed on one scale, with each laboratory's reference range kept beside its value.
Sources behind one view
Up to 30 named publications can stand behind one view of a single biomarker. Each statement in the analysis carries a chip that opens the guidance it rests on, so the basis is read rather than taken on trust.
MedAgentBench tasks
Every task on Stanford MedAgentBench completed across five runs. A benchmark is not a clinic, but it is a check on whether an analysis holds when the same cases are run again and again.
Records, on premises
Roughly 100,000 anonymised hospital records analysed inside a clinical programme without leaving the hospital's perimeter. Numbers, units, ranges and flags computed by deterministic code, never written by a model.
Who reads a blood biomarker analysis, and what each needs from it.
A clinician, a laboratory scientist and the team that evaluates an analysis before shipping it ask different questions of the same biomarker. The clinician wants the reasoning and what to consider next. The lab scientist wants a consistent reading at the release step. The evaluating team wants a method it can test on its own panels. The person whose blood it is wants plain language. Vitrubo drafts one analysis that answers all of them; the professional signs it.
The reasoning, not only the flag.
A flag says a biomarker is outside its range. An analysis says why it might be, what else in the panel moved with it, which medication on file could account for it, and which tests are worth considering. The clinician view shows all of this before the consultation, with the trend across draws beside each value and the guidance one chip away. The doctor reads, agrees or disagrees, and signs; Vitrubo drafts.
One method across every shift.
A laboratory releases results all day, and the comment beside a flagged biomarker depends on who is on shift. Vitrubo analyses each flagged blood biomarker the same way every time: against the laboratory's own reference range, against the patient's earlier results where the LIS holds them, and against the named guidance for that marker. The drafted comment sits beside the result for approval at the release step, and the follow-up test worth adding is raised while the sample is fresh.
A method you can test on your own panels.
A health app or telehealth service that adds biomarker analysis to its product has to answer for it. Vitrubo's analysis is built to be checked: the numbers come from code, not prose; every biomarker carries its LOINC code and UCUM unit; every statement names its source; and several AI models cross-check the case before a draft is shown. Run your own anonymised panels through the sandbox and compare the output against your medical team's reading, marker by marker.
How Vitrubo analyses a blood biomarker.
The value, the unit, the reference range and the flag are computed by deterministic code before any model sees the case. The same input gives the same number on every run, and no model converts a unit or decides a flag. What the models write is the reasoning around those numbers, and that reasoning is checked back against the numbers rather than the other way round.
Each blood biomarker is mapped to one of 17,000+ LOINC codes and each unit to UCUM, so a value measured by one laboratory in one unit and by another laboratory in another are analysed as one biomarker on one line. The reference range is kept per laboratory, because the range that applies to a value is the one published by the lab that measured it. Normalisation makes the trend readable; it does not overwrite the lab.
A single biomarker on a single date is read against its range. The same biomarker across several draws is read as a direction: rising, falling, steady, or back inside its range after a period outside it. Biomarkers also move together, so each is analysed alongside the others in the panel, and alongside the conditions and medications in the record that could account for a flag. The result is a pattern read, not a list of isolated flags.
Several AI models analyse the same case independently. Where they disagree, the disagreement is resolved with reference to the numbers and the guidance rather than averaged into a hedge; where one omits a finding the others caught, the omission is filled. Omissions are checked as carefully as disagreements: a biomarker one model passed over is caught because another did not. The draft the clinician sees is the outcome of that cross-check, not the first answer of one model.
Every statement in the analysis links to named medical guidance: EHA, WHO, NICE, KDIGO and BSH among others, up to 30 sources behind one biomarker view. A chip beside the statement opens the publication. Nothing is asserted that the signing clinician cannot check against the same page a specialist would read.
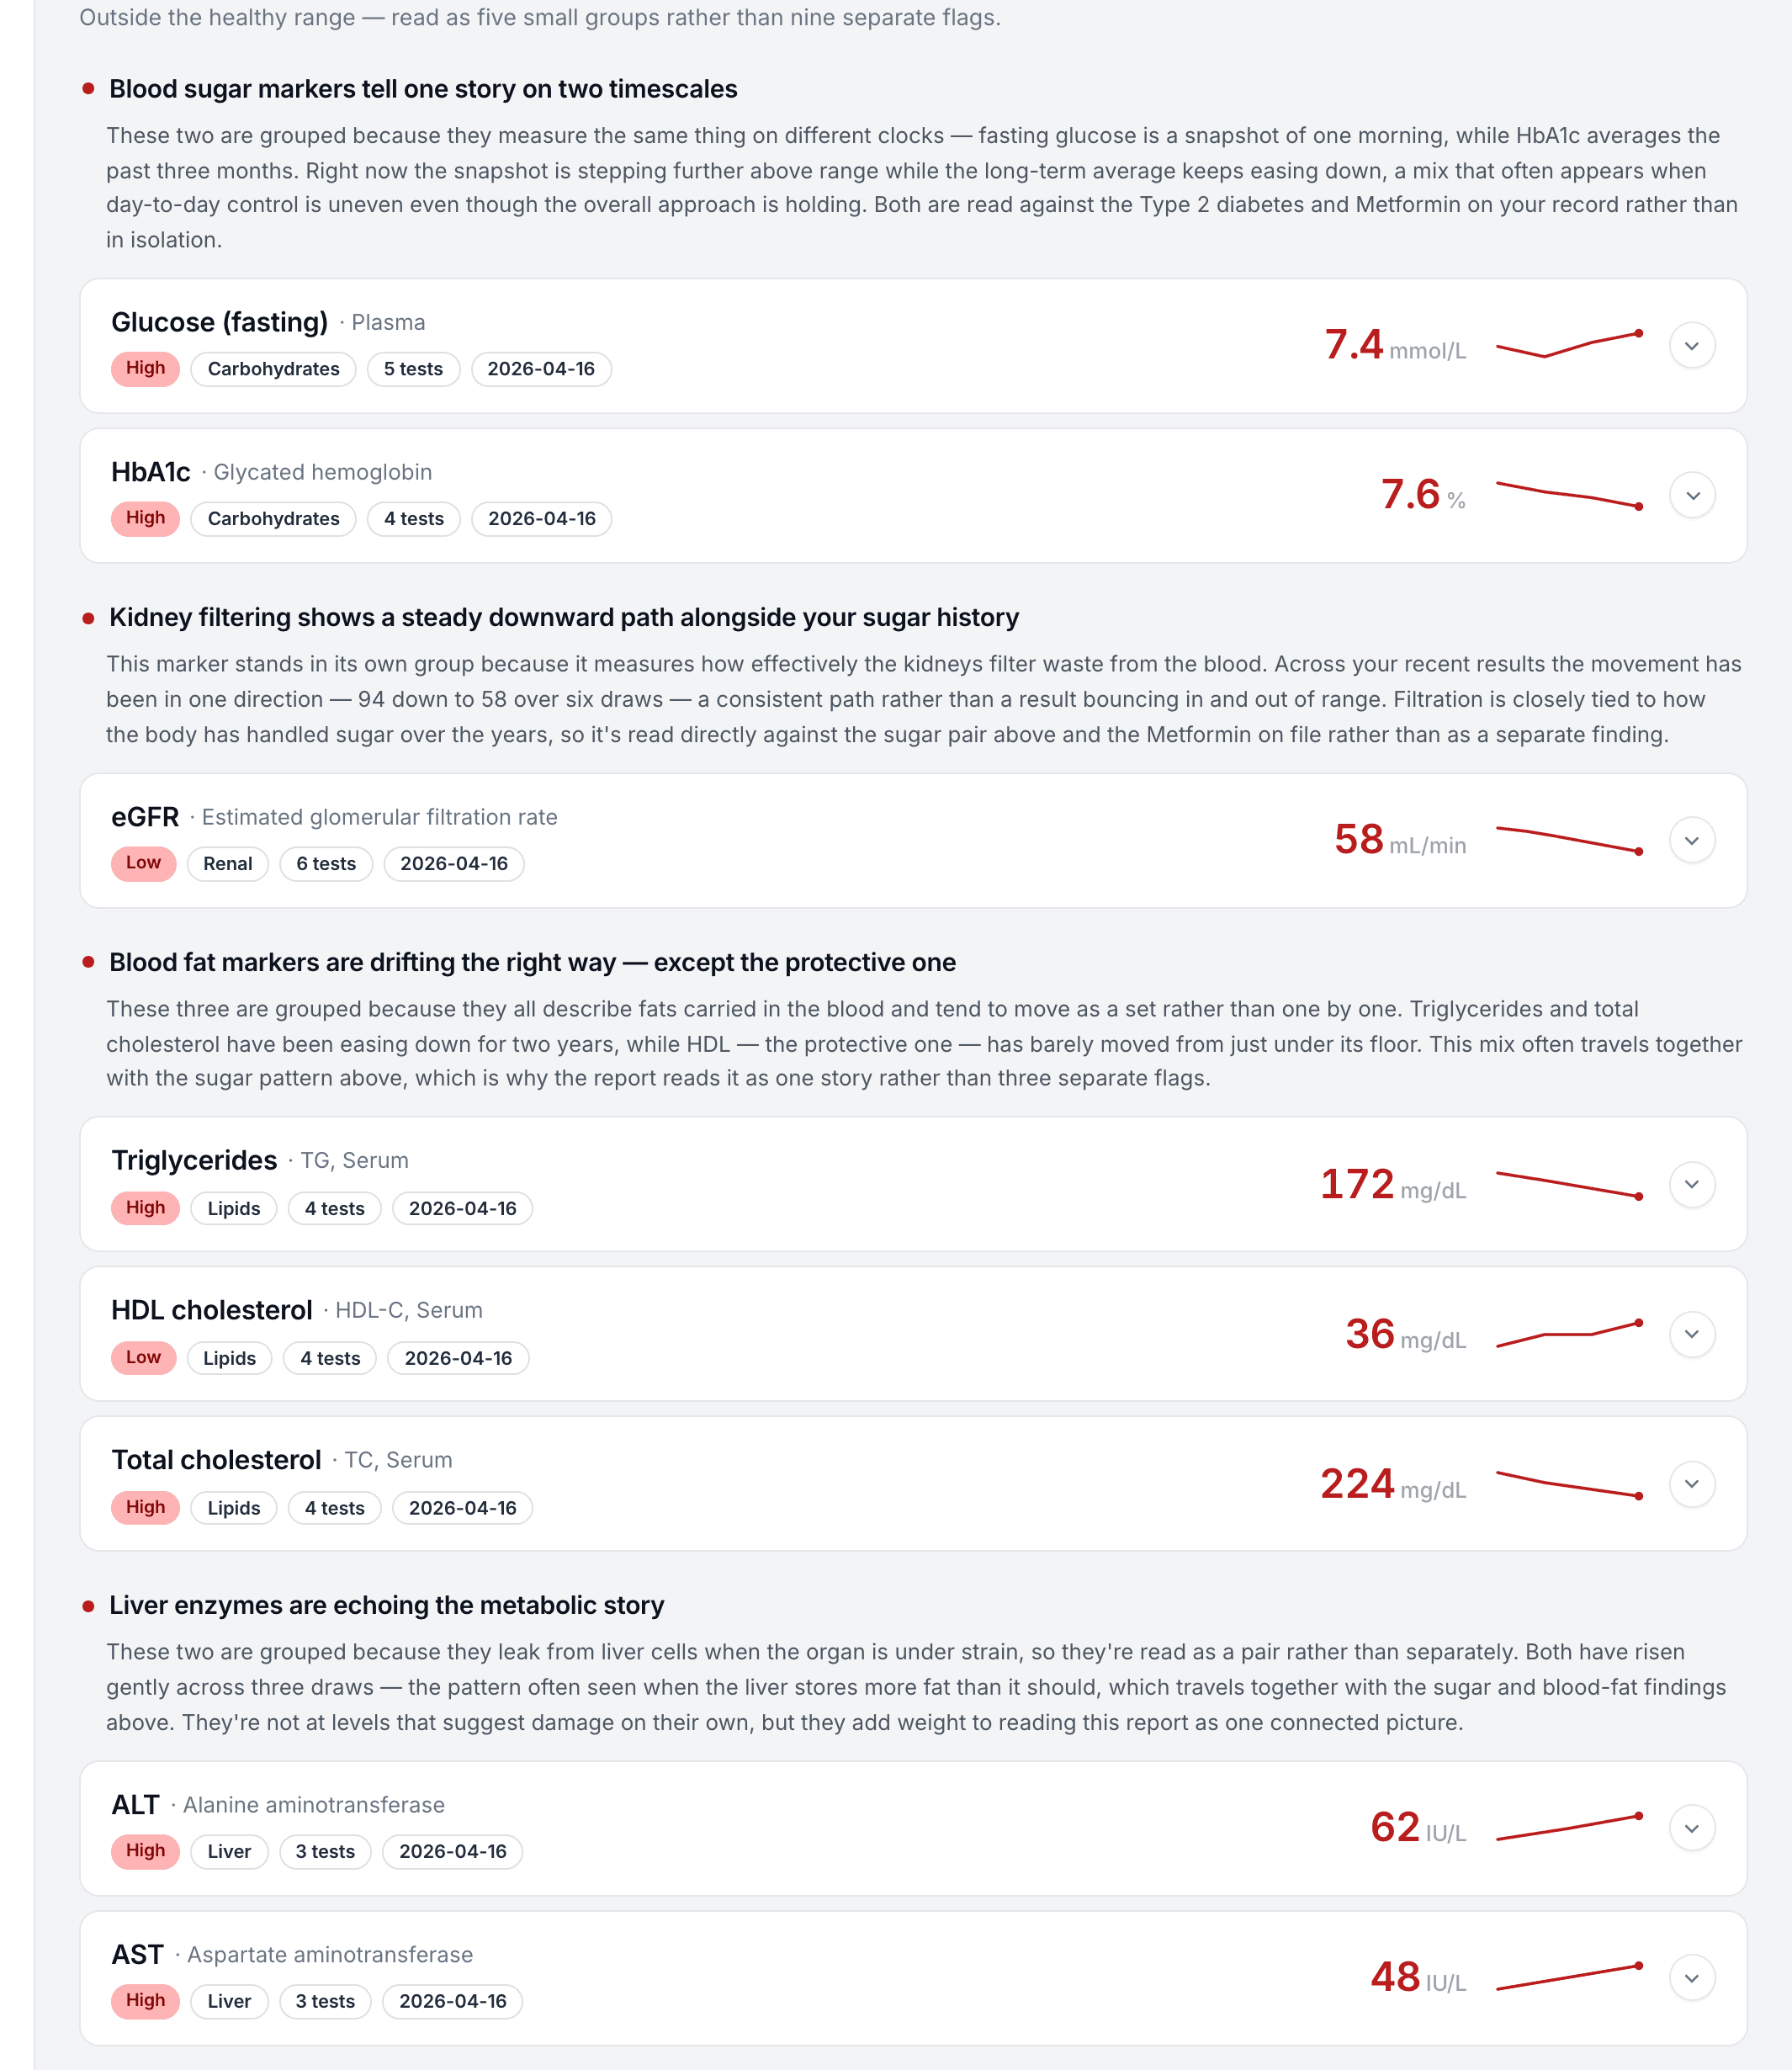
Flagged biomarkers are grouped into connected stories and placed in four zones: needs attention, worth watching, back to normal, always normal. The same analysis is delivered in two views, the clinician's with full reasoning and tests to consider, the patient's in plain language. Every new result regenerates the analysis of the whole record, and earlier versions stay as history.
A year of biomarkers, analysed together.
Robert Hensley is 58. He has been followed for chronic kidney disease over a year of quarterly visits, and his full context is supplied: history, symptoms, medications and diagnosis. His live report is the case to open for blood biomarker analysis at scale: many biomarkers on many dates, each analysed against its own trend, against the others in the panel and against the record. The analysis reads declining kidney function together with the biomarkers that move with it, recognises the markers that used to be flagged and have since improved, and marks the values that are old enough to be worth re-testing. Open the clinician view for the full reasoning and the tests to consider, and the patient view for the same analysis in plain language.
Analysis where the results already are.
Full integration.
Biomarker results arrive as HL7 or FHIR R4 from the LIS or a lab partner, the analysis flows back as FHIR or JSON into the EHR or portal, and the follow-up test is raised from the record. The analysis appears in the systems a clinician or lab scientist already opens; nothing is re-keyed by hand.
PlatformWhite label, no engineering.
A role-based portal and PDFs under your brand: the analysis for the clinician, the plain-language view for the patient, the comment for the laboratory. A blood test uploaded as a PDF or a photo is analysed the same way as an HL7 feed.
API first.
Teams with their own product take the API alone: each biomarker as a FHIR R4 Observation with its LOINC code and UCUM unit, and the analysis as JSON, ready to render. Recognition, normalisation and analysis together or one at a time.
Standards in, standards out.
LOINC for every biomarker, UCUM for every unit, SNOMED CT, ICD-10 and RxNorm for the record it is analysed against, FHIR R4 throughout. Containers on your infrastructure or a private cloud, your keys.
Why not ask a chatbot to analyse the blood test?
Because an analysis has to be checkable, and a chat answer is not.
A general-purpose model
- Reads the numbers as text. A misread decimal or a missed unit in a lab PDF goes unnoticed and becomes part of the analysis.
- Analyses the values pasted and nothing else: no earlier draw, no other panel, no medication that explains the flag.
- Applies whichever reference range it recalls, not the range the laboratory that measured the biomarker published.
- Gives one model's first answer, with no second model to catch what it missed.
- Prose without sources, so the clinician has nothing to check and nothing to sign.
Vitrubo's blood biomarker analysis
- Numbers, units, ranges and flags computed by deterministic code, never written by a model.
- Every biomarker on one LOINC and UCUM scale, with the reference range kept per laboratory.
- Each biomarker analysed against its own history, the rest of the panel, and the conditions and medications on file.
- Several AI models analyse one case and compare their reads; a disagreement is settled against the numbers and the guidance, and an omission is filled before the draft is shown.
- Every statement linked to named medical guidance, a chip away; flagged results grouped into connected stories in four zones, regenerated with every new result and kept as history.
Each statement in the analysis rests on named medical guidance. The chip beside it opens the publication the clinician would otherwise have to look up.
From first call to production, on the biomarkers you already measure.
An evaluation of Vitrubo's blood biomarker analysis runs on your own anonymised panels, in your own formats, read by your own clinician or lab scientist. Six steps, none of them a commitment until the last.
Talk to the team
A short call about which biomarkers you measure, who reads the analysis today, and where in your process a drafted analysis should appear.
Sandbox and API docs
Test access for your team, the API contract, and sample payloads for a blood biomarker panel in PDF, HL7 and JSON, with the FHIR R4 output and the analysis as JSON.
Run your own panels
Send real biomarker results, anonymised. Panels from several dates for the same person, and from more than one laboratory, show the most.
Validate the analysis
Your clinician or lab scientist reads each drafted analysis against their own reading of the same biomarkers, marker by marker, alone or together with us.
No commitment at this stage
Configuration of reference ranges, comment style and branding happens here. An evaluation is an evaluation.
Production when ready
Inside your perimeter or a private cloud, connected to the LIS, the EHR or your own product through the API.
Questions about blood biomarker analysis.
A blood biomarker is a measurable substance or property in the blood that says something about how a body system is working: haemoglobin, creatinine, ferritin, a cholesterol fraction, a thyroid hormone. The laboratory measures it; blood biomarker analysis is what happens to the number afterwards. A good analysis places each biomarker against the right reference range, against the person's earlier values, against the other biomarkers measured with it and against the conditions and medications on file, and says what the pattern suggests and what is worth doing next. Vitrubo does not perform the blood test. It is the analysis layer a laboratory, clinic or health app adds to results it already produces, and the layer a person can use to understand results they already hold.
In four steps, each of which can be inspected. Parse: the result arrives as a lab PDF, a photo, an HL7 or FHIR feed or JSON, and the value, unit, reference range and flag are computed by deterministic code. Structure: the biomarker is mapped to one of 17,000+ LOINC codes and its unit to UCUM, and it becomes an Observation in one FHIR R4 record for that person. Understand: the biomarker is analysed against its own history, the rest of the panel and the record, by several models that cross-check one another, with named guidance cited claim by claim. Deliver: a clinician view, a patient view, a PDF, or JSON through the API.
Because a number in a medical analysis has to be right on every run, and a language model is not the tool for that. Converting a unit, comparing a value with a range and deciding whether it is flagged are things code does the same way every time. Vitrubo does them in code. A scanned PDF or a photo is recognised by several models in parallel and their readings are cross-checked before a value is accepted, and the reasoning the models then write is checked back against the finished numbers. No number in the analysis is written by a model, and the flag follows the laboratory's reference range, not a threshold a model chose.
Only after normalisation. Laboratories name the same blood biomarker differently, report it in different units and publish their own reference ranges. Vitrubo maps each biomarker to one of 17,000+ LOINC codes and converts each unit to UCUM, so a value from one lab in one year and a value from another lab the next are analysed as points on one line. The reference range is not normalised away: it is kept per laboratory, because the range that applies to a value is the one the lab that measured it published. That is what lets a trend be read across laboratories without pretending the laboratories were the same.
A biomarker on one date is either inside or outside its range. The same biomarker on several dates has a direction, and the direction often says more than the latest value. A value that has crept up across a year while staying inside its range, a value that fell back into range after a period outside it, a value that has never moved: each is read differently, and the analysis says which it is. It also says how old the latest measurement is. A biomarker last measured long ago is marked as stale, and where the guidance asks for a repeat, the re-test is named beside the value. The trend is read on the normalised value, so a change of laboratory between two draws does not show up as a change in the biomarker.
Because biomarkers move together, and the meaning of one often sits in another. A borderline result can matter because of the result beside it; a flagged result can be expected because of a medication on file; a set of values each just inside its range can point in one direction when read together. Vitrubo analyses each blood biomarker alongside the others in the panel and alongside the conditions, medications and history in the record. The output is a few connected stories rather than a list of isolated flags, and each story names the biomarkers it rests on.
Several models analyse the same case independently and their outputs are compared. Where one model states a finding another does not, the omission is caught and filled; where two models read a biomarker differently, the disagreement is resolved with reference to the numbers and the guidance rather than averaged into a hedge. The draft the clinician sees is the result of that cross-check, not the first answer of one model. On Stanford MedAgentBench, Vitrubo completed 600/600 tasks across five runs.
From named publications: EHA, WHO, NICE, KDIGO and BSH among others, with up to 30 sources behind one biomarker view. Every statement in the analysis carries a chip, and the chip opens the publication the statement rests on. That is the difference between an analysis and an opinion: the clinician who signs can read the basis, agree with it or overrule it. Nothing in a Vitrubo blood biomarker analysis is asserted without a source that can be opened.
Into connected stories placed in four zones: needs attention, worth watching, back to normal, always normal. A biomarker that returned to its range since the last draw is named as such rather than quietly leaving the list, and a biomarker that has never moved is said to be steady rather than omitted. Each story carries the biomarkers behind it, the trend of each across draws, and the guidance behind the interpretation. Grouping is part of the analysis rather than a layout choice: a story exists because the biomarkers in it were read together, against the same guidance. The zones are the same in the clinician view and the patient view; what changes is the language.
They are two views of one analysis, not two analyses. The clinician view carries the full reasoning: how each biomarker was read, the conditions and medications it connects to, the sources, and the tests worth considering next. The patient view carries the same reading in plain language: which biomarkers stand out, how the stories fit together, and what to raise with a doctor. Both regenerate together whenever a new result arrives. Vitrudoc, an AI chat grounded only in the person's own record, can sit beside either view to answer questions about it.
Yes. Every new result regenerates the analysis of the whole record, not only of the new values: an earlier biomarker can move from worth watching to back to normal because of what the new draw shows, and a value that was steady can become a trend. Earlier versions of the analysis are kept as history, so the reading made at a previous visit can be revisited after the next one. A clinician comparing two versions sees which biomarker moved the reading and why. The report is a living reading of the record rather than a page written once and filed.
No. Vitrubo is not a diagnostic device, does not select or recommend treatment, and does not replace the clinician or laboratory scientist. It drafts an analysis of the biomarkers that are there, organises the record, and names the tests worth considering; the professional reads the draft and signs it, or does not. For a person reading their own results, the analysis is educational context to bring to an appointment, not medical advice. Analysis here means the reading of measured values in their context, not a clinical judgement about the person.
The laboratory keeps measuring as it does now. Results reach Vitrubo from the LIS as HL7 or FHIR R4; each flagged biomarker is analysed against the laboratory's own reference range, the patient's earlier results where they are held, and the guidance for that marker; and a drafted comment sits beside the result. The lab scientist approves, edits or discards the comment at release. Where the analysis suggests a follow-up test, it is raised while the sample is still fresh rather than after the report has gone out. The comment is drafted in the laboratory's own style, configured during the evaluation.
On its own panels, starting with a call, then sandbox access and API documentation. The team sends anonymised biomarker results in its own formats and receives the FHIR R4 record and the analysis as JSON. Its medical team reads each drafted analysis against its own reading, marker by marker: were the numbers parsed correctly, was the LOINC mapping right, was the trend read as they would read it, does the source behind each statement hold up. Panels from several dates for the same person and from more than one laboratory are the most telling, because they exercise normalisation and trend reading at once. There is no commitment at that stage; production follows when the team is satisfied, inside its perimeter or a private cloud.
Containers run on your infrastructure or in a private cloud; you own the keys and Vitrubo has no access to the data. Identity never enters the prompt: the models see biomarker values and an internal ID, never a name. Vitrubo works under a HIPAA business associate agreement for US deployments, a GDPR Article 28 processing agreement and Standard Contractual Clauses, and encryption in transit and at rest. Roughly 100,000 anonymised hospital records have been analysed this way, on premises, inside a clinical programme.
Yes, through a clinic, laboratory or health app that offers Vitrubo under its own brand; there is no self-serve signup. The person uploads the PDF or a photo of the result and reads the patient view: which biomarkers stand out, how they connect, and what to bring to the next appointment. Earlier results uploaded alongside are analysed into the same history, so one blood test is read on its own and several are read as a trend. What a good analysis of your own blood looks like is what this page describes: numbers from code, one scale across laboratories, each biomarker in context, and a source behind every statement.
Demo cases
Invented people, real product. Every case is a synthetic record with a stock portrait: no real patient, no real result. The reports are live.

Robert Hensley
58A year of CKD follow-up with full context supplied.

Emily Carter
34Five visits over nine months with no diagnosis supplied.

Ryan Hayes
30Fifteen months of lifestyle change. The direction of travel is read.
See the analysis on your own biomarkers.
A walkthrough of how a blood biomarker is analysed, sandbox access for your team, and a drafted analysis of your own anonymised panels for your clinician or lab scientist to check. Or open a live report first.